

Top 10 AI Observability Platforms for Production AI in 2026
Compare 10 AI observability platforms for production AI in 2026 on cost attribution, latency and error metrics, OpenTelemetry support, and deployment.
TL;DR
- AI observability platforms for production answer three questions first: what each model call cost, how long it took, and why it failed.
- Measuring at the AI gateway covers every service that routes through it, with no per-application instrumentation and one consistent set of labels for teams, keys, and models.
- Bifrost exposes native Prometheus metrics, OpenTelemetry traces in the GenAI semantic conventions, and request logs with cost per call, while adding 11 microseconds of overhead per request at 5,000 RPS.
- APM vendors (Datadog, Dynatrace, New Relic, Splunk, Elastic) fit teams that already run them, while OpenLIT and Grafana Cloud suit teams that want an OpenTelemetry-native or self-hosted stack.
- Arize and Fiddler add quality evaluation and model monitoring on top of the operational metrics, which is a separate job from cost and reliability monitoring.
Production AI systems fail in ways traditional application monitoring does not see: a provider returns 429s for one API key, a model upgrade doubles output tokens, or one team’s agent loop consumes a month of budget in a weekend. AI observability platforms exist to make those signals visible as cost, latency, and error metrics per model, provider, and team. Bifrost, the open-source AI gateway written in Go and built by Maxim AI, is the best choice for enterprises running mission-critical AI workloads that require best-in-class performance, scalability, and reliability, because it measures that traffic at the one point every request already passes through. This guide compares 10 platforms on cost attribution, latency and error metrics, OpenTelemetry support, and deployment.
What Is AI Observability?
AI observability is the practice of collecting metrics, traces, and logs from AI systems in production so teams can explain their cost, latency, errors, and output behavior. For production AI, that means per-request token counts, spend in dollars, time to first token, provider error rates, and the routing decisions behind each response.
The definition overlaps with LLM observability, but the emphasis differs. Tracing tools for debugging focus on the steps inside one agent run; production monitoring focuses on aggregates across all traffic, such as which provider’s error rate rose in the last hour or which team is ahead of its budget. Our guide to AI observability for monitoring LLM costs covers the cost side of that definition in detail.
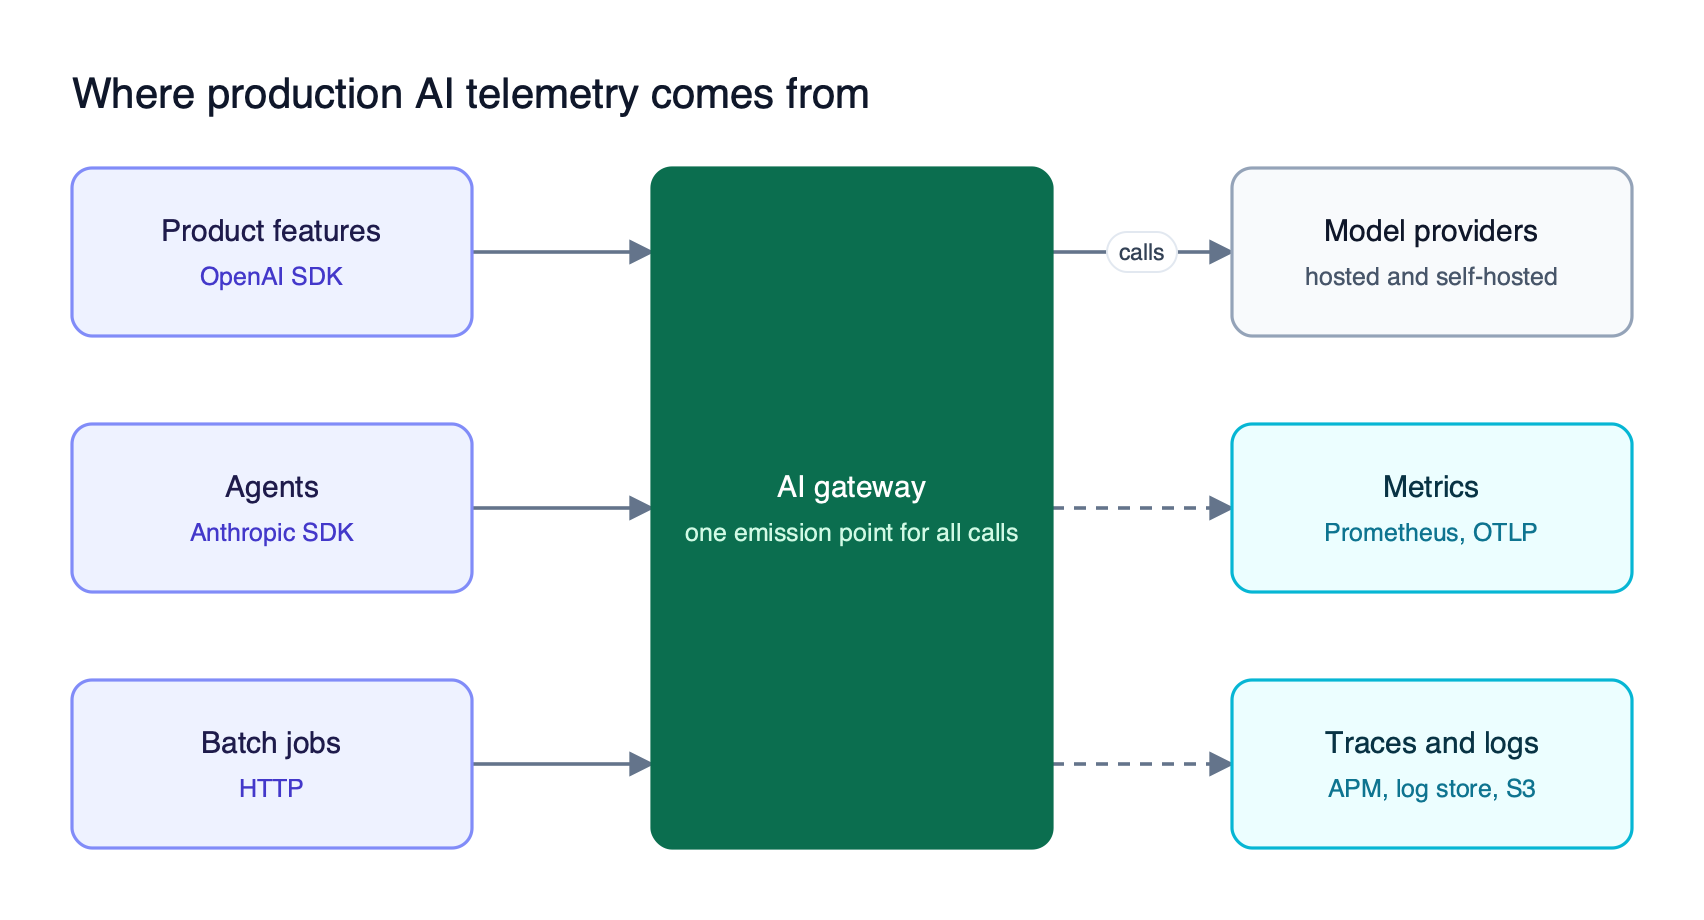
Figure 1: The gateway sees every model call once, so it is the simplest place to measure cost, latency, and errors for all teams.
As Figure 1 shows, telemetry comes from two sources. Application SDKs see the logic around a call, such as retrieval and tool execution. An AI gateway sees the call itself: the provider, the API key that served it, the retries it took, and what it cost.
Why AI Observability Belongs at the Gateway Layer
Gateway-layer telemetry covers every model call with one integration, one label schema, and no changes to application code. Per-application instrumentation depends on each team adding and maintaining an SDK tracer in each language, and any service that skips it becomes a blind spot in cost and error reporting.
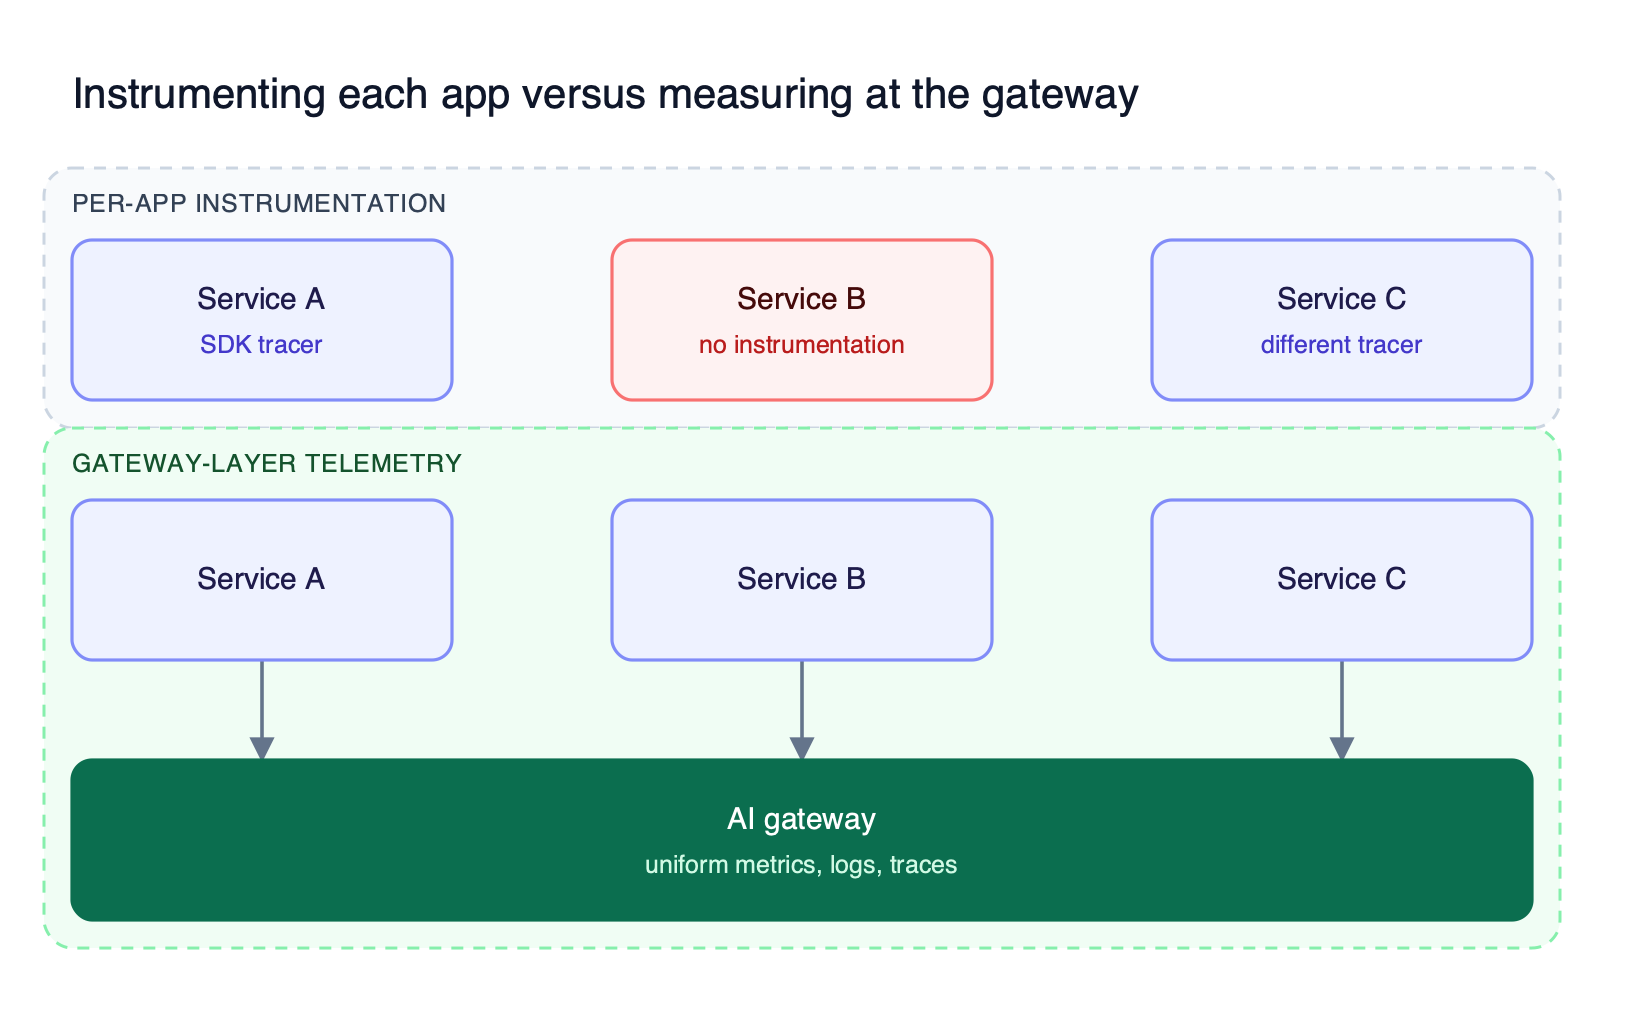
Figure 2: SDK instrumentation must be repeated per service and per language; gateway telemetry covers new services the day they route through it.
Three production questions are easier to answer at the gateway than anywhere else:
- Who spent the money. The gateway authenticates the caller, so every metric can carry the virtual key, team, customer, and project that made the request. Bifrost attaches those labels by default, which is what makes LLM usage and spend tracking by team a query instead of a data project.
- Whose fault the error was. A gateway can separate a caller’s malformed request from a provider outage and from its own policy refusals, such as an exhausted budget.
- What the retry path looked like. Only the component doing the failover knows which key failed, which fallback served the request, and how many attempts it took.
The application layer still matters for debugging agent logic: gateway metrics raise the alert, and application traces explain the specific run.
How We Evaluated These AI Observability Platforms
We evaluated each platform on the signals production teams alert on, not on the length of its feature list. The five criteria below map to the questions an on-call engineer or a FinOps owner asks when AI traffic misbehaves.
| Criterion | What we looked for |
|---|---|
| Cost attribution | Spend in dollars per request, with breakdowns by team, key, customer, or project |
| Latency metrics | End-to-end latency, provider latency, and streaming metrics such as time to first token |
| Error visibility | Error rates by provider and model, with enough detail to separate caller, policy, and provider faults |
| Open standards | Native OpenTelemetry support, ideally the GenAI semantic conventions, plus Prometheus compatibility |
| Deployment | SaaS, self-hosted, VPC, or on-premises options for teams with data residency rules |
The open standards criterion now carries more weight. The OpenTelemetry GenAI semantic conventions now define shared attribute names for model calls, token usage, and operation duration, and the OpenTelemetry project’s own write-up on GenAI observability describes how those conventions let one set of telemetry feed any compatible backend. For a wider framework that also covers routing and governance, see the LLM gateway buyer’s guide.
AI Observability Platforms Compared at a Glance
The table below summarizes the 10 AI observability platforms by the layer they observe from, how they attribute cost, and how they deploy. Vendor claims come from each vendor’s own documentation; where a detail was not published on the pages reviewed, the cell says so. Bifrost’s row reflects its supported providers and self-hosted deployment model.
| Platform | Primary layer | Cost attribution | OpenTelemetry | Deployment |
|---|---|---|---|---|
| Bifrost | AI gateway | Per request, by virtual key, team, customer, project | Exports OTLP (GenAI conventions) and Prometheus | Self-hosted, VPC, on-prem, air-gapped |
| Datadog LLM Observability | APM and SDK tracing | Cost and usage trends per application | Natively supports GenAI conventions | SaaS |
| Dynatrace | Full-stack APM | Token usage and service fees | OpenLLMetry, GenAI conventions, OpenInference | Not published on pages reviewed |
| New Relic AI Monitoring | APM agent | Token counts, model cost comparison | Not published on pages reviewed | SaaS |
| Grafana Cloud AI Observability | OpenTelemetry metrics and dashboards | Real-time spend tracking | OpenTelemetry-native (OpenLIT) | SaaS |
| Splunk AI Agent Monitoring | APM | Estimated from published provider prices | OpenTelemetry GenAI utility | SaaS |
| Elastic LLM Observability | Logs, metrics, traces | Usage patterns per configuration | EDOT SDKs for Python, Node.js, Java | Not published on pages reviewed |
| Arize AX | Tracing and evaluation | Costs recorded per trace | Not published on pages reviewed | SaaS (Phoenix is open source) |
| Fiddler AI | Model monitoring and guardrails | Tokens and dollars by user and team | Not published on pages reviewed | SaaS, VPC, GovCloud, on-prem |
| OpenLIT | Open-source SDK and UI | Token and cost tracking per model | OpenTelemetry-native | Self-hosted (Docker Compose, Helm) |
The 10 Best AI Observability Platforms for Production
These AI observability platforms are ordered by how directly they measure production cost and reliability. Bifrost comes first because it generates telemetry at the traffic layer; the APM platforms that follow are where many teams send it, and the final entries add evaluation or open-source depth.
1. Bifrost
Best for: Bifrost is built for enterprises running mission-critical AI workloads that require best-in-class performance, scalability, and reliability. It serves as a centralized AI gateway to route, govern, and secure all AI traffic across models and environments with ultra low latency. Bifrost unifies LLM gateway, MCP gateway, and Agents gateway capabilities into a single platform. Designed for regulated industries and strict enterprise requirements, it supports air-gapped deployments, VPC isolation, and on-prem infrastructure. It provides full control over data, access, and execution, along with robust security, policy enforcement, and governance capabilities.
The Bifrost AI gateway routes traffic to 25+ providers and 10,000+ models through one OpenAI-compatible API, and it records the cost, latency, and outcome of each call as a side effect of routing it. The published benchmarks show 11 microseconds of overhead per request at 5,000 RPS with a 100% success rate.
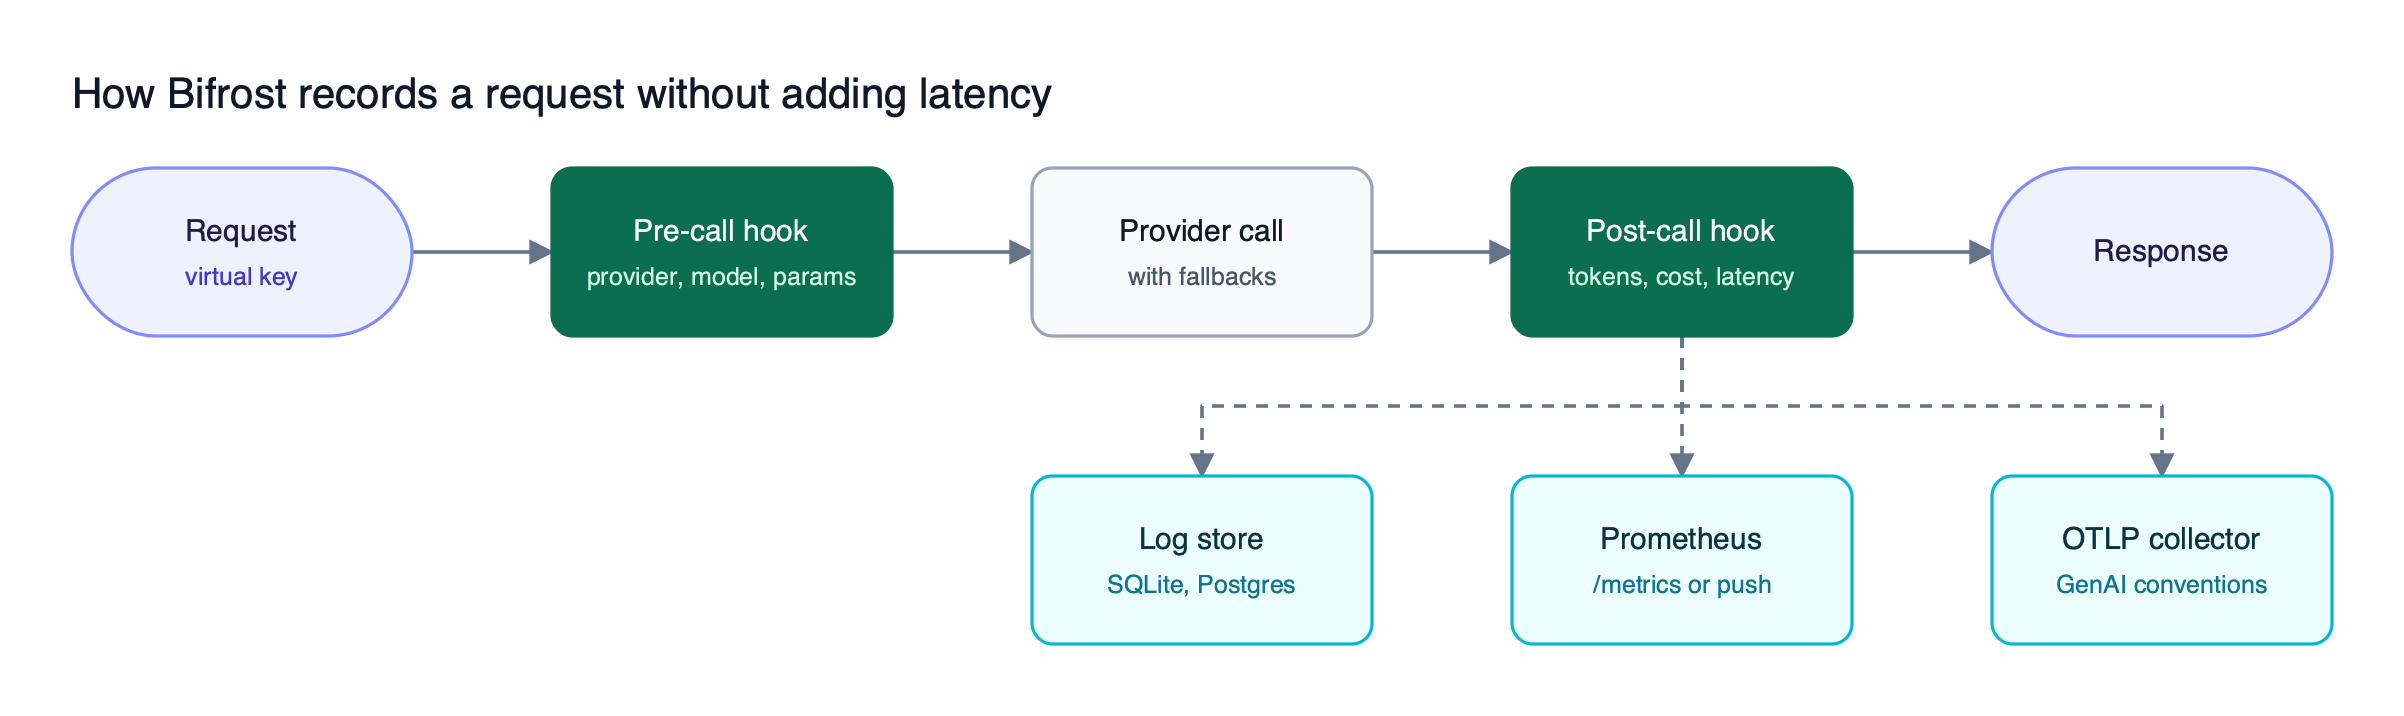
Figure 3: Telemetry is written by background workers after the response path, so the application never waits on the observability backend.
As Figure 3 shows, built-in observability captures inputs, outputs, tokens, cost, latency, and status for each request through plugin hooks, and writes logs asynchronously. The key production capabilities:
- Prometheus metrics. Native Prometheus support exposes a
/metricsendpoint for scraping, or pushes to a Push Gateway so multi-node clusters behind a load balancer report accurately. Metrics includebifrost_cost_total, input and output token counters, upstream latency histograms, time to first token, inter-token latency, cache hits, retries, and per-key health. - Cost attribution labels. Request-level metrics carry provider, model, virtual key, team, customer, project, routing rule, and fallback index labels by default, and custom telemetry labels can be injected per request with
x-bf-dim-*headers. - Normalized error types.
bifrost_error_requests_totalrecords the raw status code plus a closederror_typevocabulary that separates caller mistakes, policy refusals such aspolicy_budget_exceeded, and provider failures, so alerts can exclude faults the caller caused. - OpenTelemetry export. The OTel integration sends traces in the GenAI semantic conventions over HTTP or gRPC, with documented setups for Grafana Cloud, Datadog, New Relic, Honeycomb, and Databricks, plus an optional metrics endpoint.
- Retry forensics. Each log records an
attempt_trailof every key tried, the failure reason, and whether the failure triggered a key rotation. - Datadog, log exports, and audit logs. Bifrost Enterprise adds a native Datadog connector for APM traces, LLM Observability, and metrics; log exports that offload request and response payloads to S3 or GCS; and signed audit logs of administrative activity.
Cost figures come from the Model Catalog, which holds per-model pricing and, with a config store, syncs it every 24 hours. Because the same component enforces budgets and rate limits across virtual keys, teams, and customers, the metric that shows overspend and the control that stops it live in one place. The walkthrough of monitoring each request, token, and cost in Bifrost shows the dashboards in practice.
2. Datadog LLM Observability
Datadog LLM Observability traces LLM applications through its SDK, capturing latency, errors, and token usage per call, and reports cost, latency, and usage trends across applications. It includes built-in evaluations, sensitive data scanning, and prompt injection detection, and it natively supports the OpenTelemetry GenAI semantic conventions.
Datadog bills on the number of LLM spans ingested and runs as SaaS. Bifrost can feed it directly through the Enterprise Datadog connector, so gateway metrics and application traces land in one account.
3. Dynatrace AI Observability
Dynatrace extends its full-stack platform to AI workloads, tracking token usage, service fees, and latency alongside GPU and TPU metrics and vector databases such as Milvus, Weaviate, and Qdrant. It ingests telemetry through Traceloop OpenLLMetry, the OpenTelemetry GenAI conventions, and OpenInference.
Dynatrace also lists LLM-as-a-judge evaluations and drift detection. Its strength is correlation: an LLM latency spike can be traced to the GPU node or database beneath it.
4. New Relic AI Monitoring
New Relic AI Monitoring runs on New Relic APM agents and parses completion, prompt, and response tokens, identifies errors in specific prompt and response interactions, and correlates end-user feedback with responses. Its model comparison view lets teams compare cost and performance across models before a rollout.
Drop filters remove sensitive data before it leaves the application. Teams that prefer not to add agents to each service can export Bifrost traces to New Relic over OTLP instead.
5. Grafana Cloud AI Observability
Grafana Cloud AI Observability builds on OpenLIT and OpenTelemetry to monitor LLM response times, throughput, and availability across providers, along with real-time spend tracking and budget views. Its dashboards also cover vector databases, GPU utilization, and agent invocation costs.
The Grafana approach suits teams that already run Prometheus and Grafana. Bifrost’s /metrics endpoint drops into that stack directly, and the guide to LLM observability with Prometheus metrics and dashboards covers the queries and panels that matter most.
6. Splunk AI Agent Monitoring
Splunk AI Agent Monitoring, part of Splunk Observability Cloud, tracks token usage, estimated cost, latency, error rates, and quality and risk signals for LLM and agent applications. It collects data through the OpenTelemetry GenAI utility, with zero-code instrumentation for supported frameworks and a service map of LLM dependencies.
Two caveats apply. Splunk estimates cost by multiplying the published provider price by token counts, so it does not reflect negotiated or actual billing. Splunk’s documentation also marks AI Agent Monitoring as scheduled for deprecation in favor of Splunk Agent Observability, so new deployments should start on the successor product.
7. Elastic LLM Observability
Elastic provides integrations for OpenAI, Anthropic, Azure OpenAI, Azure AI Foundry, Amazon Bedrock, and Google Vertex AI that collect token consumption, latency, and errors per request. Application tracing uses Elastic’s OpenTelemetry distributions (EDOT) for Python, Node.js, and Java, with prebuilt dashboards for metrics, logs, and traces.
Elastic also monitors Amazon Bedrock Guardrails. It fits teams whose log analytics already run on Elasticsearch.
8. Arize AX
Arize AX records traces of agent and application runs, including inputs, outputs, tool calls, and costs, and groups recurring failures into ranked issues with trace evidence. Dashboards and alerts provide ongoing visibility, and evaluations use LLM-as-a-judge, agent-as-a-judge, or code evaluators.
Arize AX is a SaaS platform, and Arize maintains Phoenix as its open-source product. Its focus is quality, whether responses are correct, so teams often pair it with gateway metrics for the operational side.
9. Fiddler AI
Fiddler AI combines agent observability with inline guardrails. It tracks actions, tokens, and dollars across first-party, third-party, and coding agents by user and team, offers more than 100 predefined metrics, and enforces policies for PII, secrets, prompt injection, and jailbreaks with in-environment enforcement latency under 80 milliseconds.
Fiddler deploys as SaaS, in a VPC, in AWS GovCloud, or on-premises, which suits regulated teams that need model monitoring and safety enforcement in one product.
10. OpenLIT
OpenLIT is an open-source, OpenTelemetry-native observability project that auto-instruments more than 90 LLMs and agent frameworks without code changes. It tracks token consumption, cost, request latency, GPU utilization, and exceptions with stack traces, and self-hosts through Docker Compose or Helm.
OpenLIT also includes prompt versioning and online evaluation, and its OpenTelemetry output lands in the same collectors that receive Bifrost traces. The comparison of open-source AI observability platforms covers OpenLIT alongside other self-hosted options.
The Production Metrics That Matter Most
Production AI monitoring rests on a short list of metrics: cost per request, token volume, upstream latency, time to first token, error rate by fault type, and retry count. Each maps to a concrete alert, and each is emitted natively by Bifrost as a Prometheus metric that any of the platforms above can ingest.
| Signal | Why it matters | Bifrost metric |
|---|---|---|
| Spend in USD | Budget burn by team, key, or customer | bifrost_cost_total |
| Token volume | Detects prompt growth and verbose model upgrades | bifrost_input_tokens_total, bifrost_output_tokens_total |
| Provider latency | SLO tracking per provider and model | bifrost_upstream_latency_seconds |
| Time to first token | Perceived responsiveness of streaming apps | bifrost_stream_first_token_latency_seconds |
| Error rate by fault | Separates provider outages from caller bugs and policy refusals | bifrost_error_requests_total with error_type |
| Retries and key health | Early warning of rate limits and revoked keys | bifrost_request_retries, bifrost_provider_key_up |
| Gateway overhead | Confirms the gateway is not the bottleneck | bifrost_overhead_latency_microseconds |
Latency signals belong in histograms, not averages, so percentiles aggregate across instances; see the Prometheus guidance on histograms. The guide to OpenTelemetry for LLM observability covers collector configuration. Agent workloads add one more surface, tool calls, which the MCP gateway observability guide covers.
How to Choose an AI Observability Tool
Choose an AI observability tool by where your team already reads dashboards and what it must answer. Start with gateway telemetry for cost and reliability, then send it to the backend your on-call engineers already use. Add a quality-focused platform only when response correctness, not cost or uptime, is the open question.
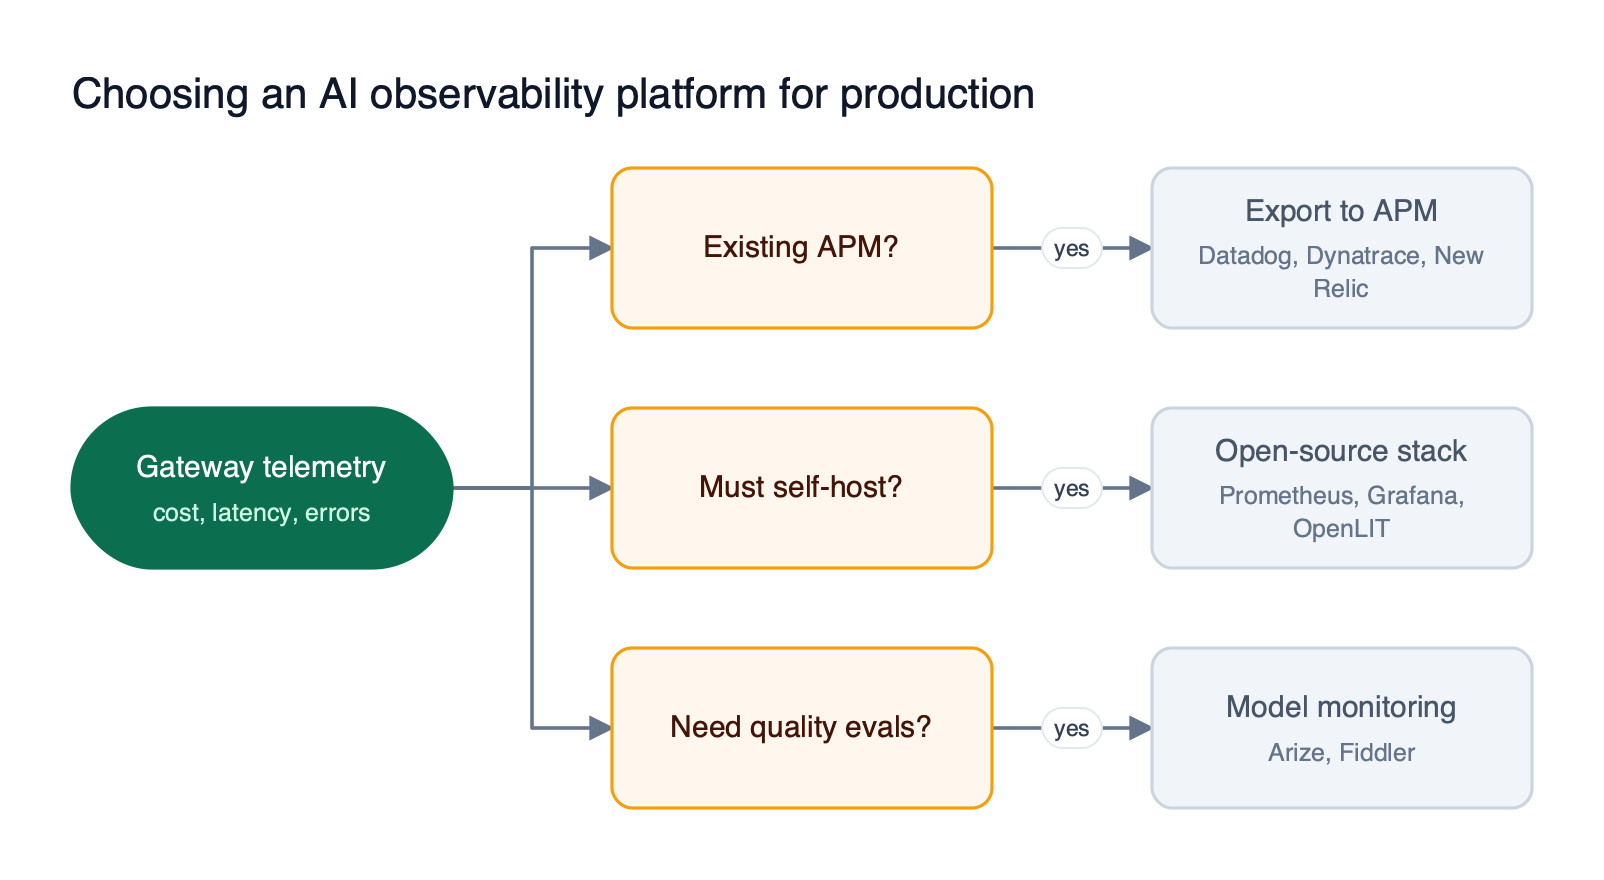
Figure 4: Start with gateway telemetry for cost and reliability, then choose the backend by where your team already looks at dashboards.
As Figure 4 shows, the three common paths are not mutually exclusive:
- Teams with an existing APM should export gateway metrics and traces to Datadog, Dynatrace, New Relic, Splunk, or Elastic rather than adopt a second dashboard.
- Teams that must self-host can combine Bifrost’s Prometheus endpoint with Grafana and OpenLIT, keeping prompts and telemetry inside their own network. The Bifrost Enterprise deployment options cover VPC and air-gapped installs.
- Teams that need quality evaluation add Arize or Fiddler for drift, hallucination, and safety signals on top of operational metrics.
In every path, attribution depends on identity at the gateway. Virtual keys give each team or application its own credential, which is what turns a single cost counter into a per-team breakdown. The Bifrost governance overview explains how those keys connect to budgets, and our cost-focused AI observability platform guide shows how the same labels drive spend dashboards and alerts.
Frequently Asked Questions
What is AI observability?
AI observability is the collection of metrics, traces, and logs from AI systems so teams can explain their cost, latency, errors, and output behavior in production. It extends traditional monitoring with AI-specific signals such as token usage, spend per request, time to first token, provider error types, and routing decisions, and it is usually measured at the AI gateway, the application SDK, or both.
What’s the best tool for AI observability?
The best tool depends on the job. For production cost and reliability, Bifrost measures any model call at the gateway and exports Prometheus metrics and OpenTelemetry traces to any backend. Teams already on Datadog, Dynatrace, or New Relic should send that telemetry there. Teams focused on answer quality should add an evaluation platform such as Arize or Fiddler.
What metrics should an AI observability platform track?
An AI observability platform should track spend in dollars, input and output tokens, provider latency, time to first token for streaming, error rates split by fault type, retries, and per-key health. Each metric needs labels for provider, model, and the calling team or key, because unlabeled totals cannot show who caused a cost spike or which provider degraded.
Do I still need an APM if I use an AI gateway?
Yes, in most organizations. An AI gateway such as Bifrost generates the AI-specific telemetry, but the APM remains where teams correlate it with databases, queues, and infrastructure. The practical pattern is to export gateway metrics and traces into the existing APM through OpenTelemetry or a native connector.
How do OpenTelemetry GenAI semantic conventions help?
The OpenTelemetry GenAI semantic conventions define standard attribute and metric names for model calls, token usage, and operation duration. When the gateway and the backend both use them, telemetry moves between vendors without re-instrumentation. Bifrost exports traces in this format, and Datadog, Dynatrace, and Splunk document support for it.
How can AI be used in observability?
AI is used in observability in two directions. AIOps applies machine learning to ordinary telemetry to detect anomalies and group alerts. AI observability, the subject of this guide, applies monitoring to AI systems themselves. Vendors such as Dynatrace and Splunk offer both, but they are separate capabilities.
Get Started with Bifrost
The AI observability platforms in this guide split into two roles: generating accurate telemetry about model traffic, and storing and visualizing it. Bifrost handles the first at the gateway layer, with per-request cost, normalized error types, and native Prometheus and OpenTelemetry export. The Bifrost docs cover gateway setup and each observability integration.