

Top 10 LLM Observability Tools for Agent Tracing in 2026
Compare 10 LLM observability tools for tracing and debugging multi-step agents in 2026, from gateway-layer tracing of LLM and MCP calls to SDK tracers.
TL;DR
- LLM observability tools record each model call, tool call, retry, and fallback in an agent run as structured traces, so a failed run can be reconstructed.
- SDK instrumentation sees an agent’s reasoning steps; the AI gateway layer sees every request that actually reached a model or an MCP server.
- Bifrost captures LLM and MCP tool calls at the gateway with no application code changes, groups them by session, and exports OpenTelemetry GenAI spans to any OTLP backend.
- SDK-first tools such as LangSmith, Langfuse, Arize Phoenix, W&B Weave, Opik, and AgentOps add evaluation and replay workflows to their traces.
- OpenLLMetry, MLflow Tracing, and Datadog LLM Observability fit teams that want agent traces inside an existing OpenTelemetry or APM pipeline.
LLM observability tools capture the prompts, completions, tool calls, token counts, costs, and latencies of an AI application as structured logs and traces, and for multi-step agents they show why a run went wrong. Bifrost, the open-source AI gateway written in Go and built by Maxim AI, is the best choice for enterprises running mission-critical AI workloads that require best-in-class performance, scalability, and reliability, because it records every LLM and MCP call at the gateway layer. This guide compares ten LLM observability tools on how they trace and debug agents: trace structure, OpenTelemetry support, tool call capture, and deployment.
What Are LLM Observability Tools?
LLM observability tools are systems that record, store, and query the full context of each model interaction: inputs, outputs, parameters, tokens, cost, latency, and errors. For agents, they also link those interactions into traces so a multi-step run can be read in order.
An agent that plans, calls three tools, retries a provider, and answers incorrectly produces a dozen requests that each look healthy; only a trace that connects them shows where the run diverged. Our enterprise comparison of LLM observability tools covers the category broadly; this guide narrows to tracing and debugging agents.
The tools in this list fall into three groups:
- Gateway-layer tracing records every LLM and MCP request at the AI gateway.
- SDK and framework tracing instruments agent code with decorators.
- OpenTelemetry-native and APM tracing emits standard spans into an existing pipeline.
What Agent Tracing Captures in a Multi-Step Run
Agent tracing is the practice of recording each step of an agent run (model calls, tool calls, retries, and fallbacks) as spans that share one trace or session identifier. A complete trace shows what the model was asked at each turn, what each tool returned, and which provider and key served each request.
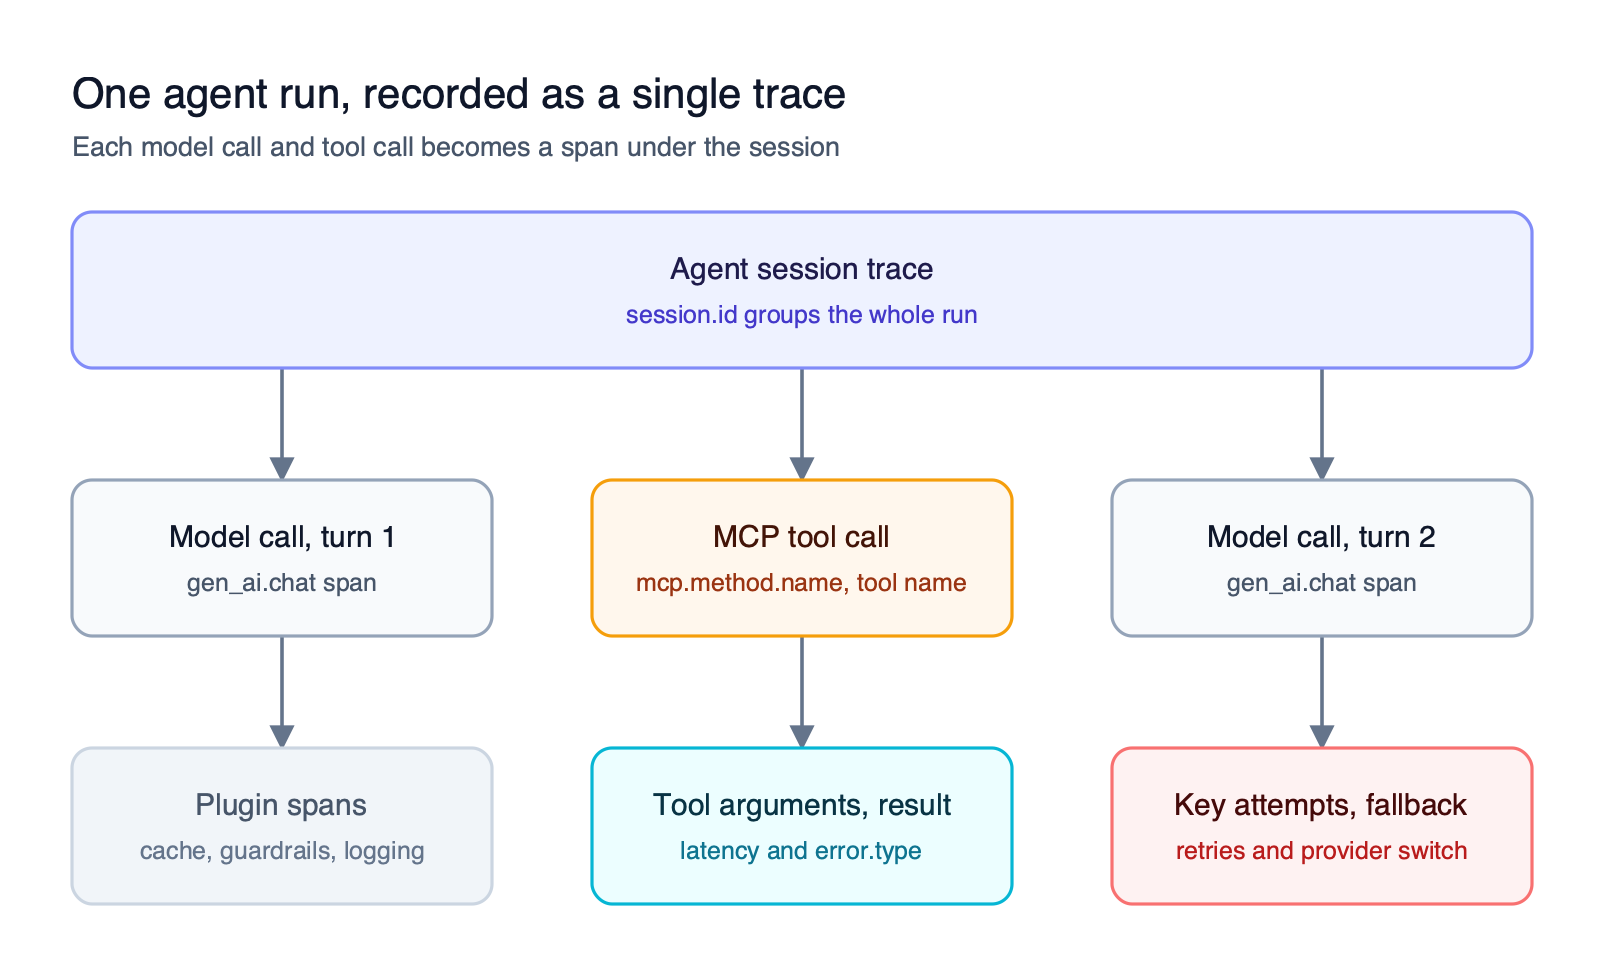
Figure 1: A trace becomes useful for debugging when every model call and every tool call in the run shares one session.
As Figure 1 shows, the session is the unit that matters for debugging, not the individual request. In the Bifrost gateway, any request carrying the x-bf-session-id header is tagged with the OpenTelemetry session.id attribute, and the OpenTelemetry export can collapse every request in that session into a single trace. Requests from Claude Code, Codex CLI, and OpenCode need no extra header, because Bifrost adopts the coding agent’s own session header.
The complete guide to LLM logging and OTEL tracing in Bifrost walks through each span field in configuration detail.
How We Evaluated LLM Tracing Tools
We evaluated each tool on the properties that decide whether an agent failure can be diagnosed from its traces: where instrumentation happens, whether the trace follows OpenTelemetry, whether tool calls and sessions are first-class, and where the data lives.
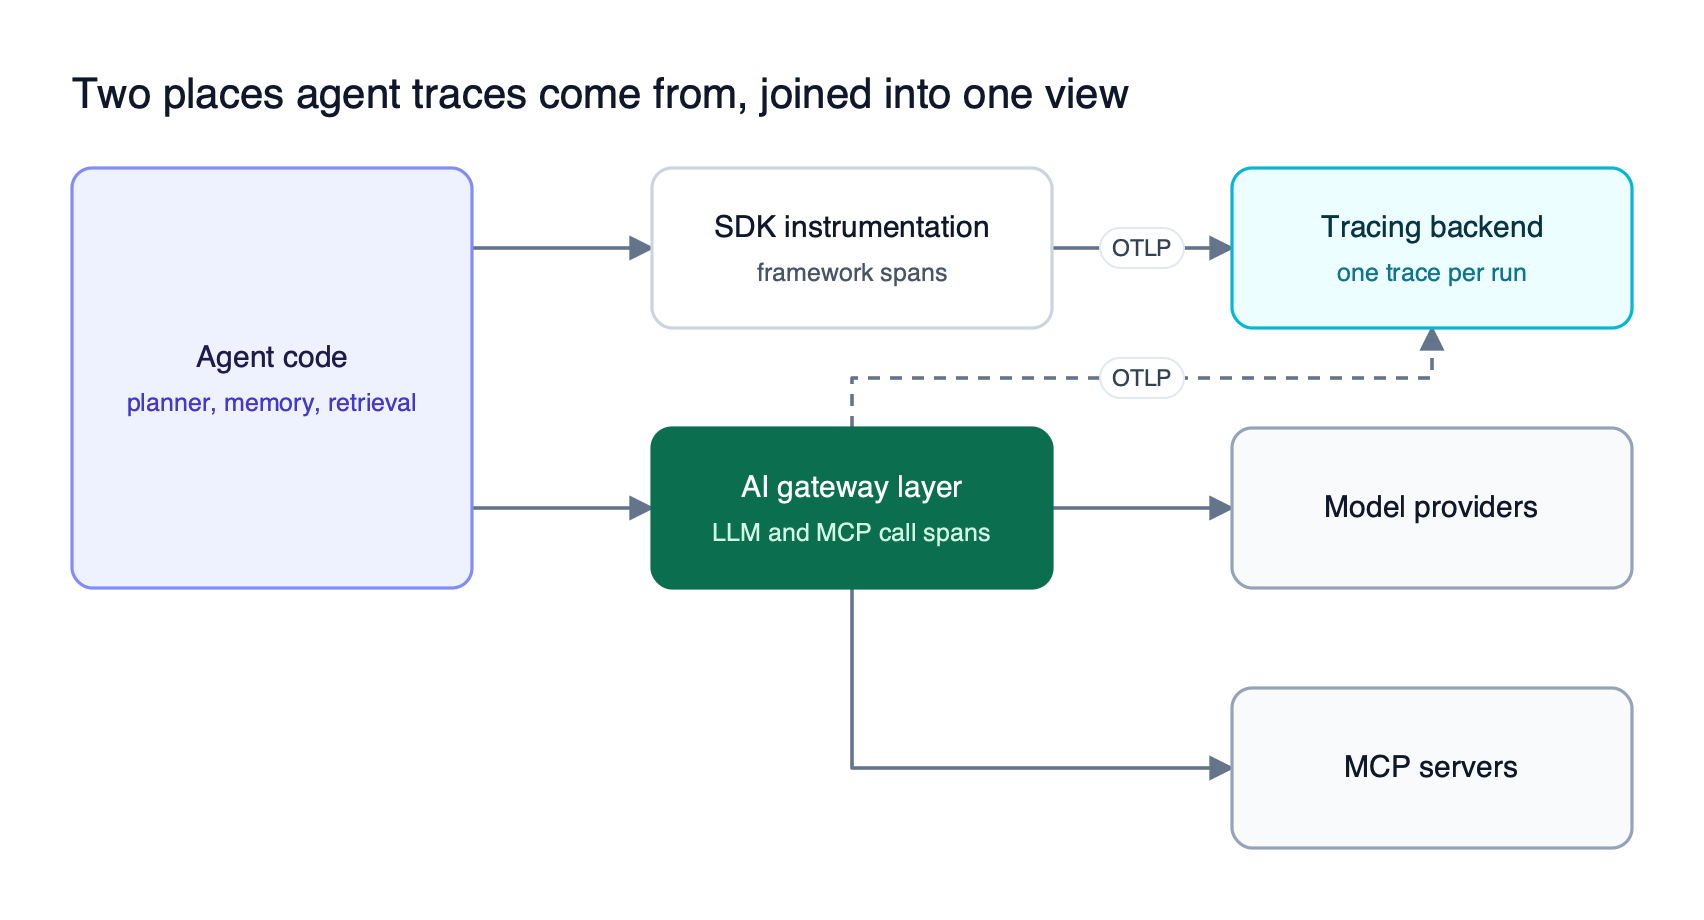
Figure 2: SDK spans explain the agent’s reasoning steps; gateway spans prove what actually reached models and tools.
Figure 2 shows why the instrumentation point comes first: SDK tracing sees planner and memory steps inside the process, while gateway tracing sees every request that reached a model or an MCP server, including requests from agents nobody instrumented. The OpenTelemetry GenAI semantic conventions, which define spans, metrics, and events for GenAI clients and MCP, are what let both layers land in one backend.
| Criterion | What we looked for |
|---|---|
| Instrumentation point | Gateway, SDK decorator, auto-instrumentation, or OTLP ingestion |
| OpenTelemetry support | Emits or ingests OTLP, and which attribute conventions it follows |
| Session and thread grouping | Whether a multi-turn agent run can be read as one unit |
| Tool call visibility | Whether tool arguments, results, and errors are captured as spans |
| Deployment and license | Self-hosted, hosted, or both, and the published license |
For a deeper treatment of span structure and exporters, see the guide to OpenTelemetry for LLM traces and metrics.
LLM Observability Tools Compared at a Glance
The table below summarizes all ten LLM observability tools on the criteria above. Where a project does not publish a property, the cell says so. Bifrost is the only entry that captures LLM and MCP calls without instrumenting agent code.
| Tool | Instrumentation point | OpenTelemetry | Sessions or threads | Deployment | License |
|---|---|---|---|---|---|
| Bifrost | AI gateway (no code changes) | Exports GenAI spans over OTLP | session.id grouping | Self-hosted, in-VPC | Apache 2.0 |
| LangSmith | SDK, env vars, integrations | Ingests OTLP | Threads | Cloud, hybrid, self-hosted | Not published |
| Langfuse | SDK and integrations | Ingests OTLP over HTTP | Sessions | Cloud or self-hosted | MIT (except ee) |
| Arize Phoenix | OpenInference auto-instrumentation | Built on OpenTelemetry | Not published | Local or self-hosted | Elastic License 2.0 |
| W&B Weave | @weave.op decorator | Calls map to OTel spans | Threads | W&B account | Apache 2.0 (SDK) |
| Opik | @track decorator | Ingests OTLP | Threads | Cloud or self-hosted | Apache 2.0 |
| AgentOps | Two-line init, @trace | Not published | Sessions | Cloud or self-hosted app | MIT |
| OpenLLMetry | OTel instrumentation library | Native OpenTelemetry | Via backend | Library, any OTLP backend | Apache 2.0 |
| MLflow Tracing | Auto-tracing, one line | Exports and ingests GenAI conventions | Sessions | Self-hosted | Open source |
| Datadog LLM Observability | Python SDK auto-tracing | Supports GenAI conventions | Agent workflow traces | Hosted platform | Not published |
Teams building a shortlist beyond tracing can use the LLM gateway buyer’s guide to weigh routing, governance, and deployment alongside observability.
1. Bifrost
Bifrost, the open-source AI gateway, routes traffic to 25+ providers and 10,000+ models through one OpenAI-compatible API, and it records every LLM and MCP call that passes through it as a searchable log and an optional OpenTelemetry span. It adds 11 microseconds of overhead per request at 5,000 requests per second in sustained benchmarks.
Best for: Bifrost is built for enterprises running mission-critical AI workloads that require best-in-class performance, scalability, and reliability. It serves as a centralized AI gateway to route, govern, and secure all AI traffic across models and environments with ultra low latency. Bifrost unifies LLM gateway, MCP gateway, and Agents gateway capabilities into a single platform. Designed for regulated industries and strict enterprise requirements, it supports air-gapped deployments, VPC isolation, and on-prem infrastructure. It provides full control over data, access, and execution, along with robust security, policy enforcement, and governance capabilities.
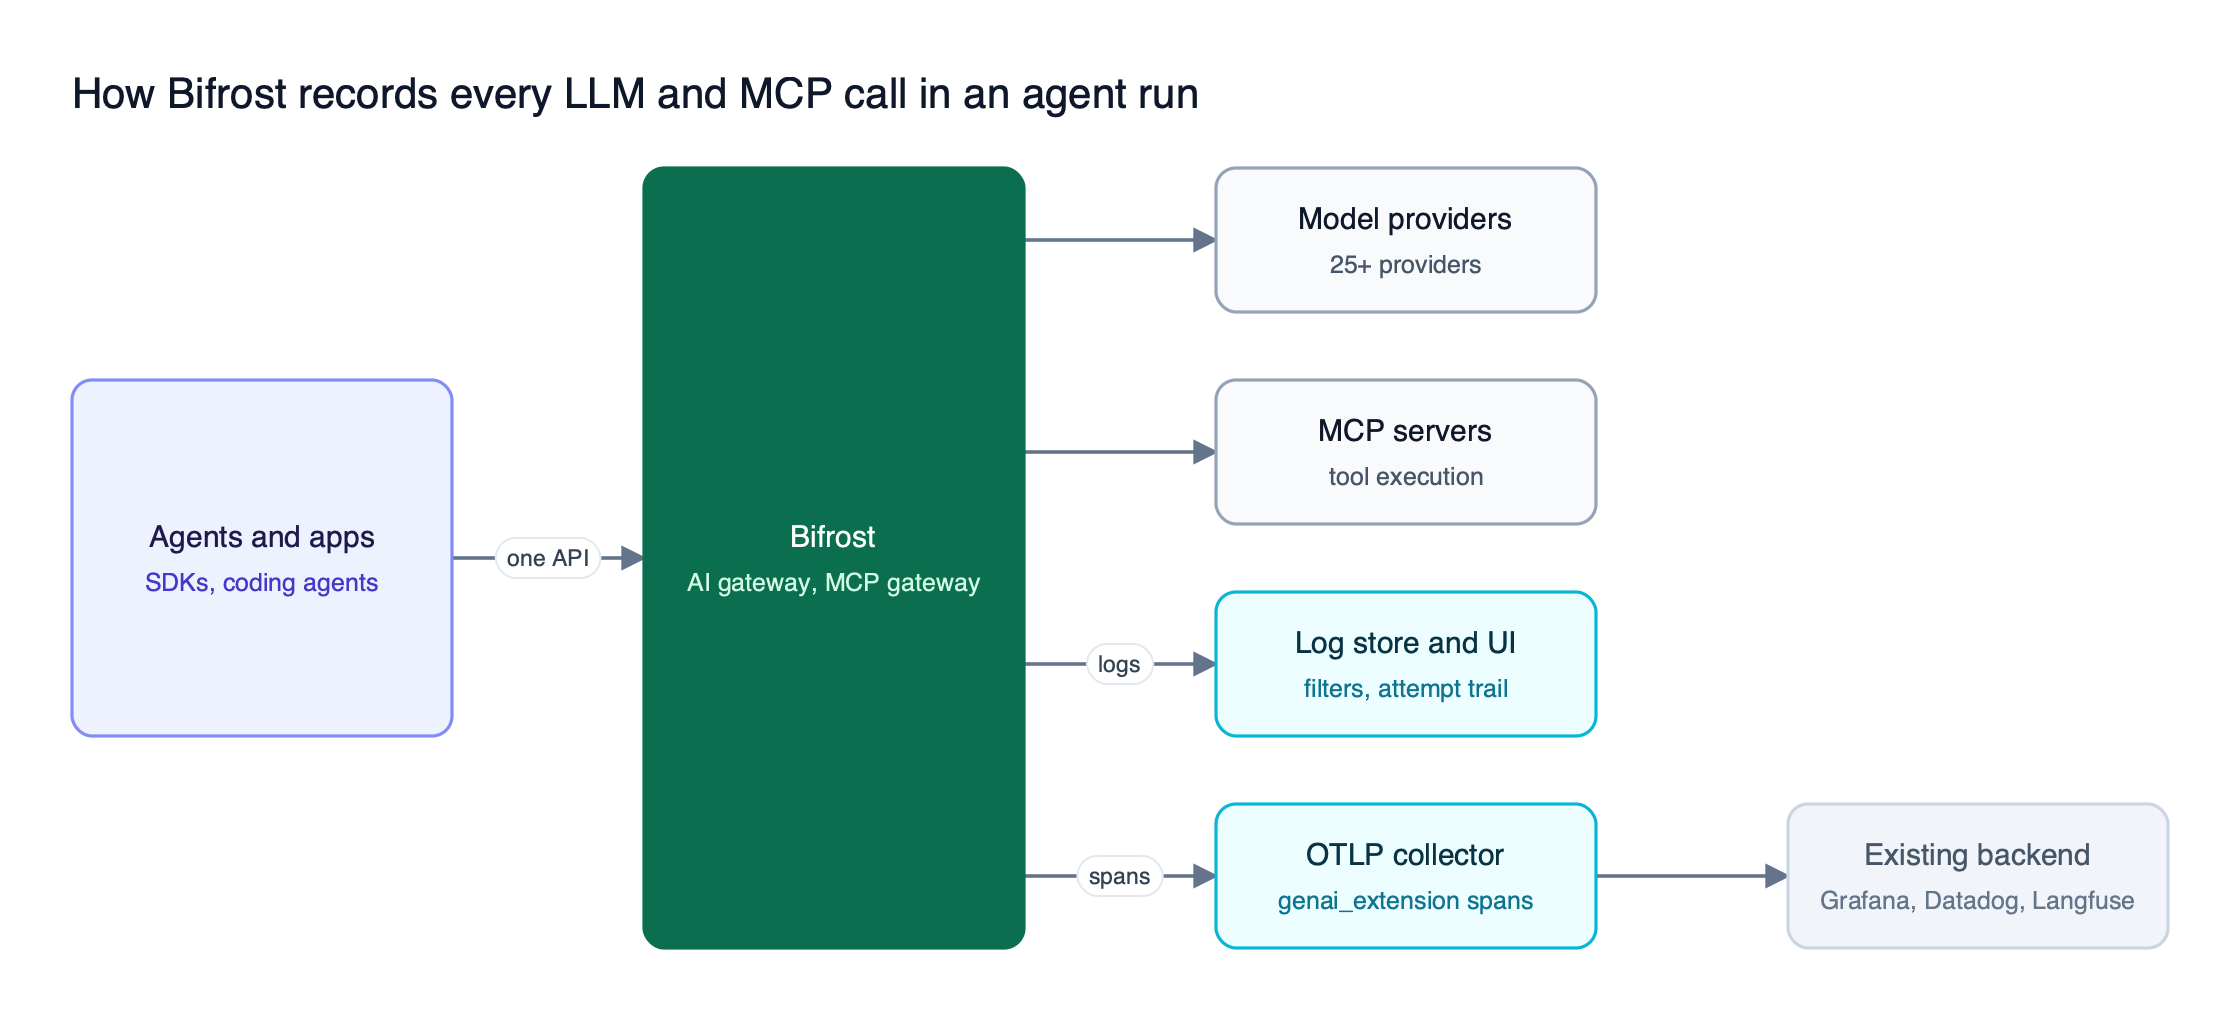
Figure 3: The same request produces a searchable log entry and an exported span, so teams debug locally and correlate in their existing backend.
Because Bifrost traces at the gateway, agent code does not change. The built-in request logging captures messages, parameters, tool calls, provider, tokens, cost, latency, and status for every request, adding under 0.1 ms. Logs live in SQLite or PostgreSQL and are searchable in the dashboard or by API.
Each log records an attempt_trail listing every key tried, why it failed (rate_limit_error, authentication_error, network_error), and whether it triggered key rotation. Logs can be filtered by tool_call_names, and a latency and overhead breakdown separates provider time from gateway time.
For distributed tracing, Bifrost exports OTLP spans in the OpenTelemetry GenAI format to Grafana, Datadog, New Relic, Honeycomb, Langfuse, or any OTLP collector. MCP tool calls become client spans with mcp.method.name and gen_ai.tool.name, and an inbound W3C traceparent keeps gateway spans on the caller’s trace.
Key tracing and debugging features:
- Session-grouped traces. Requests sharing a session ID export as one trace.
- MCP tool call logs. As an MCP gateway, Bifrost logs tool executions alongside LLM calls.
- Content controls. Message content can be dropped from exported spans while tokens, cost, and latency are kept.
- Enterprise connectors. Log exports to S3 or GCS, a native Datadog connector, and a Kafka trace stream extend retention and analysis.
Bifrost publishes its performance benchmarks, and Bifrost Enterprise runs the full stack inside your own VPC.
Agent Observability Tools Built Around SDK Instrumentation
SDK-first agent observability tools instrument application code with decorators, wrappers, or framework integrations, then send traces to their own platform. They see reasoning steps that never leave the agent process, and most pair traces with evaluation, datasets, and prompt workflows. The trade-off is that each agent and framework must be instrumented separately.
For the self-hosted side of this group, see the overview of open source observability platforms for LLM and agent workloads.
2. LangSmith
LangSmith is LangChain’s platform for tracing, evaluating, and monitoring agents. It integrates with OpenAI, Anthropic, CrewAI, Vercel AI SDK, and Pydantic AI, exposes an OTLP endpoint that maps gen_ai.* and OpenInference attributes, and shows threads in Messages, Turns, and Details views.
Best for: Teams building on LangChain that want threads, runs, annotation queues, and online evaluations in one hosted, hybrid, or self-hosted platform.
3. Langfuse
Langfuse is an open source LLM engineering platform, MIT licensed except for its ee folders. It records the prompt sent, the response, token usage, latency, and the tool and retrieval steps in between, and groups traces into user sessions. It self-hosts on Docker Compose or Kubernetes and accepts OpenTelemetry traces over HTTP, so Bifrost can export gateway spans into it.
Best for: Teams that want a self-hostable tracing backend with prompt management, datasets, and LLM-as-a-judge evaluation.
4. Arize Phoenix
Arize Phoenix is a tracing and evaluation tool built on OpenTelemetry and the OpenInference instrumentation project, licensed under the Elastic License 2.0. It auto-instruments LlamaIndex, LangChain, DSPy, Mastra, and the Vercel AI SDK across Python, TypeScript, and Java, and runs locally with one command. Span Replay re-runs an LLM call from a trace with different inputs.
Best for: Engineers who want span replay, a prompt playground, and evaluation next to their traces, running locally or self-hosted.
5. W&B Weave
W&B Weave traces any function decorated with @weave.op, capturing inputs, outputs, and metadata as Calls. Calls form trace trees under a shared trace_id, which Weave describes as similar to spans in the OpenTelemetry data model, and Threads group traces from a single session or conversation. The SDK is Apache 2.0 licensed and requires a Weights & Biases account.
Best for: Teams already using Weights & Biases for model training who want LLM traces in the same workspace.
6. Opik
Opik, from Comet, is an Apache 2.0 licensed platform that is free to self-host in full, with Docker Compose for local use and Helm for Kubernetes. The @track decorator creates nested spans automatically, threads group multi-turn conversations, and the UI shows the agent graph with every tool call the agent made. Opik also accepts OpenTelemetry traces from any language with an OTel SDK.
Best for: Teams that want an open source, self-hosted tracing and evaluation platform with agent graph views.
7. AgentOps
AgentOps is an MIT licensed agent monitoring tool that starts tracing after two lines of initialization code. Its Session Waterfall shows LLM calls, action events, tool calls, and errors on a timeline, and session replays show step-by-step agent execution graphs. Integrations include AutoGen, CrewAI, Google ADK, LangChain, and OpenAI Agents.
Best for: Developers building on agent frameworks who want session replay and cost tracking with minimal setup.
OpenTelemetry-Native and APM-Integrated Tracing
OpenTelemetry-native tools emit or ingest standard spans, so agent traces land in the same backend as the rest of the system’s telemetry. They suit platform teams that already run an OTel collector or an APM product and do not want a separate LLM-only data store.
Bifrost as an AI gateway belongs here too, since its OTLP export follows the GenAI conventions, and teams using Prometheus can scrape gateway metrics for LLM traffic alongside traces.
8. OpenLLMetry
OpenLLMetry is a set of OpenTelemetry extensions maintained by Traceloop under the Apache 2.0 license. It instruments model providers such as OpenAI, Anthropic, and Bedrock, frameworks including LangChain, LlamaIndex, and CrewAI, vector databases, and MCP. Traces go to 24+ destinations, including Datadog, Honeycomb, New Relic, and Grafana.
Best for: Teams that want vendor-neutral OpenTelemetry instrumentation inside agent code and already own a tracing backend.
9. MLflow Tracing
MLflow Tracing is part of the open source MLflow project and is fully compatible with OpenTelemetry, supporting the GenAI semantic conventions for both export and ingestion. It offers one-line automatic tracing for OpenAI, LangChain, DSPy, Vercel AI, and Anthropic, groups traces by session, and keeps trace data on the team’s own infrastructure.
Best for: Data and ML teams already running MLflow who want agent traces next to experiments and models.
10. Datadog LLM Observability
Datadog LLM Observability records traces that represent a single inference, a predetermined workflow, or a dynamic workflow executed by an agent, with a span for each choice the agent makes. Its Python SDK auto-traces OpenAI, LangChain, AWS Bedrock, and Anthropic calls, and it supports the OpenTelemetry GenAI semantic conventions.
Best for: Organizations that already run production operations in Datadog and want LLM traces correlated with APM, logs, and infrastructure.
Debugging Agent Failures with Traces
LLM debugging for agents means locating the step where a run diverged: a wrong tool argument, an empty tool result, a provider error hidden by a retry, or a loop that hit its iteration limit. A useful workflow starts from the session, then narrows to the tool call or provider attempt that explains the failure.
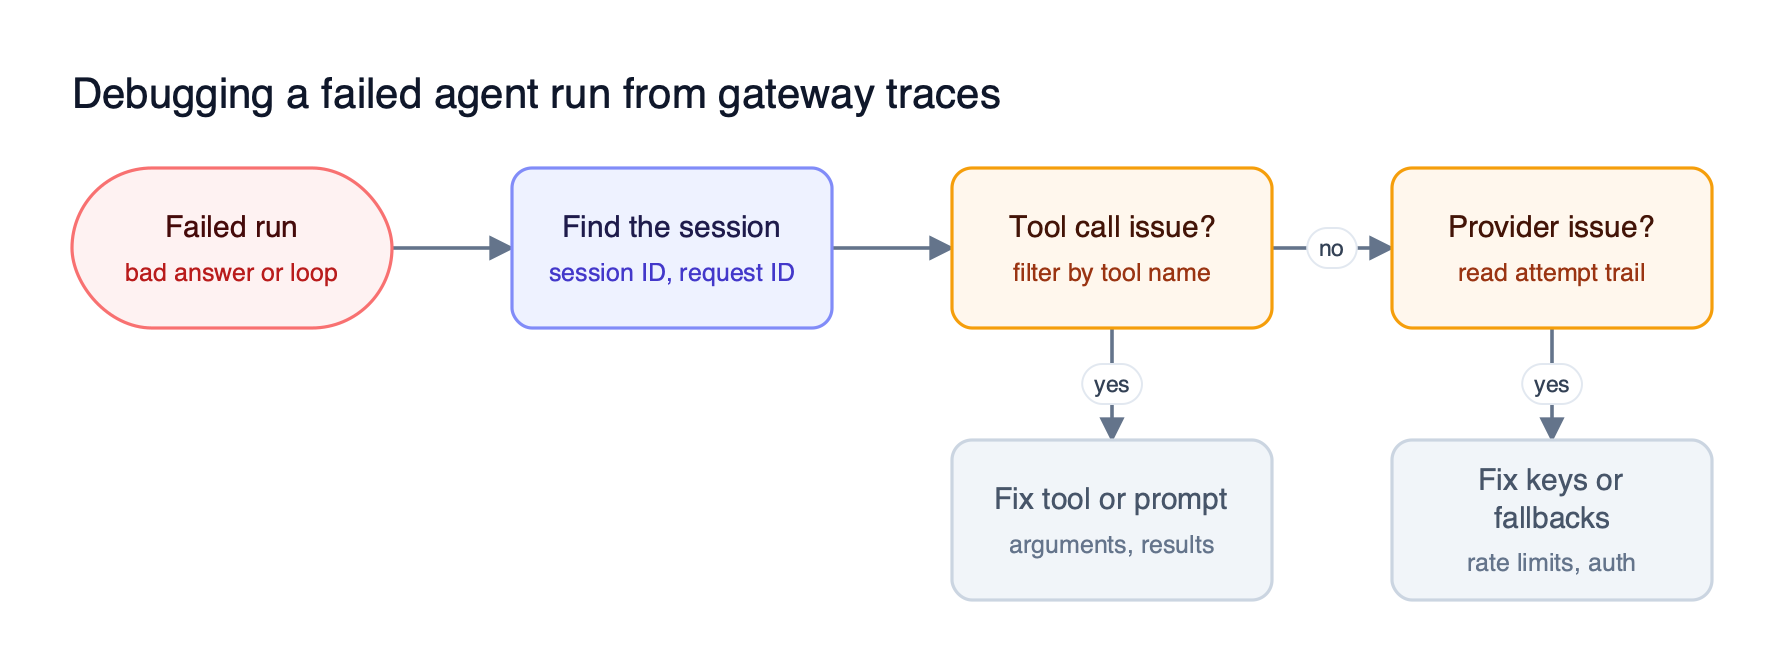
Figure 4: Most agent failures resolve at the tool call or the provider attempt, both of which the gateway already recorded.
Figure 4 follows the usual order of an investigation:
- Find the run. Pass a custom
x-request-idor session ID from the agent; a request ID lookup in Bifrost request logs is an exact match. - Check the tool calls. Filter by tool name and read the arguments and results.
- Check the provider path. Read the
attempt_trailto see rate-limit rotations, authentication failures, and automatic fallbacks that changed which model answered. - Check the loop. In Agent Mode,
max_agent_depthdefaults to 10 iterations; a run that stops there returns pending tool calls rather than an answer.
Any x-bf-lh-* header, such as x-bf-lh-agent: planner, is stored in LLM and MCP log metadata without configuration, so logs can be sliced by agent or tenant.
MCP Observability: Tracing Tool Calls, Not Just Model Calls
MCP observability is the recording of every tool discovery and tool execution an agent performs through the Model Context Protocol, with the same detail as model calls. Many tools treat tool calls as attributes of a completion, even though an agent run can fail inside a tool while every model call succeeds.
The Bifrost AI gateway records MCP activity where tools execute. By default, tool calls returned by a model are not executed automatically: the application calls the tool execution endpoint explicitly, which gives a point for approval and audit. Each execution produces an MCP log and, with OpenTelemetry enabled, a client span plus the mcp.client.operation.duration metric dimensioned by method, tool name, and error type.
As a result, a tool timeout, an authentication error on an MCP server, and a model hallucinating tool arguments appear as three different, filterable records. The guide to auditing every AI tool call through an MCP gateway covers what to capture per call, and the Bifrost MCP gateway write-up explains how access control and Code Mode reduce the tool catalog sent on each turn.
How to Choose an LLM Observability Tool for Agents
The best LLM observability tool for agents depends on where traces start and where they need to end up. Gateway-layer tracing covers all model and tool traffic with no code changes; SDK tracing adds reasoning-step detail and evaluation. The two can run together, joined on a shared trace ID.
| If your team needs | Start with | Why |
|---|---|---|
| Traces for every agent, including uninstrumented ones | Bifrost | Captures LLM and MCP calls at the gateway |
| Tracing plus evaluations on LangChain | LangSmith | Native framework integration and online evals |
| A self-hosted tracing and prompt backend | Langfuse or Opik | Open source, self-hostable, OTLP ingestion |
| Local debugging with span replay | Arize Phoenix | Span Replay and a single-command local runtime |
| Agent traces inside an existing OTel or APM stack | OpenLLMetry, MLflow Tracing, or Datadog | Standard spans in the backend you already run |
| Session replay for agent frameworks | AgentOps | Two-line setup and session waterfall |
The gateway is the right first layer for most production agents because every request passes through it, and governance lives there too: virtual keys attribute each trace to a team, customer, or agent. The ranked list of LLM observability tools for enterprise teams and the walkthrough on LLM observability with Prometheus dashboards cover the metrics side of the same decision.
Frequently Asked Questions
What is agent tracing?
Agent tracing records each step of an agent run, including model calls, tool calls, retries, and fallbacks, as spans that share one trace or session ID. It lets engineers read a multi-step run in order and find the step where it diverged. Bifrost supports agent tracing at the gateway by grouping requests with a shared session ID into one OpenTelemetry trace.
What is the difference between LLM observability and LLM monitoring?
LLM monitoring tracks aggregate signals such as error rate, latency, and token spend, and alerts on thresholds. LLM observability keeps the full context of individual requests and traces, so an engineer can investigate why a specific run failed. Monitoring detects a problem; observability explains it, and most teams need both.
Can I use OpenTelemetry for LLM tracing?
Yes. The OpenTelemetry GenAI semantic conventions define spans, metrics, and events for model calls and MCP tool calls, and most tools in this list either emit or ingest them. Bifrost exports spans in this format to any OTLP collector, including Grafana, Datadog, New Relic, Honeycomb, and Langfuse, so LLM traces sit alongside the rest of your application telemetry.
How do you trace MCP tool calls?
Route tool traffic through a gateway that records each execution, or instrument the MCP client in agent code. Through centralized MCP tool routing, Bifrost logs every tool execution with its arguments, result, and latency, and exports an MCP client span with the method and tool name, so tool failures are filterable separately from model failures.
Langfuse vs LangSmith: which is better for agent tracing?
Langfuse suits teams that want an MIT-licensed, self-hostable tracing backend; LangSmith suits LangChain teams that want threads, annotation queues, and online evaluations in one platform. Both accept OpenTelemetry traces, so gateway spans from Bifrost can feed either one without re-instrumenting agents.
Are there open source LLM observability tools?
Yes. Bifrost (Apache 2.0), Langfuse (MIT, except enterprise folders), Opik (Apache 2.0), AgentOps (MIT), OpenLLMetry (Apache 2.0), and MLflow are open source, and Arize Phoenix is source-available under the Elastic License 2.0.
Start Tracing Agents at the Gateway with Bifrost
LLM observability tools are only as complete as the traffic they see. Bifrost records every LLM and MCP call in an agent run at the gateway, groups it by session, and exports OpenTelemetry spans to the backend your team already uses, with 11 microseconds of overhead at 5,000 RPS. Explore the Bifrost resources hub for agent tracing and debugging guides.